ADL Matrix
Visual Tools to Manage Your Product Portfolio
Analyze your competitive position in the market to devise new strategies.
- Customizable ADL matrix templates to conduct in-depth analysis of your competitive landscape
- In-app video and audio conferencing to connect with key stakeholders
- Centralize your strategic plans for easy reference

Over 10 Million people and 1000s of teams already use Creately

Visually Plot Your Competitive Position

Professional and customizable ADL templates to analyze industry life-cycle and your organizations strategic position.
Infinite canvas that allows you to connect to multiple strategic frameworks and create effective plans.
Simple to use drag and drop tools to easily conduct a multivariate competitive analysis.
Create Effective Strategic Plans

Import data from multiple sources to create an information rich ADL matrix and better manage your product portfolio.
Link shapes and workspaces together for easy navigation to conduct competitive analysis on multiple SBUs simultaneously.
Embed documents and reference links to specific tasks and use in-app previews for easy access.
Advanced data panel to add additional information, create follow ups and action plans.


Exchange Ideas Freely

Real-time cursors for any number of participants. Collaborate with team members or leads as you plan expansion based on competitive position and industry maturity.
In-app video and audio conferencing to connect with teams to discuss implementation of strategies.
Multiple access levels and roles to share the plans with relevant team members as viewers, reviewers, and editors.
What Is the ADL Matrix?
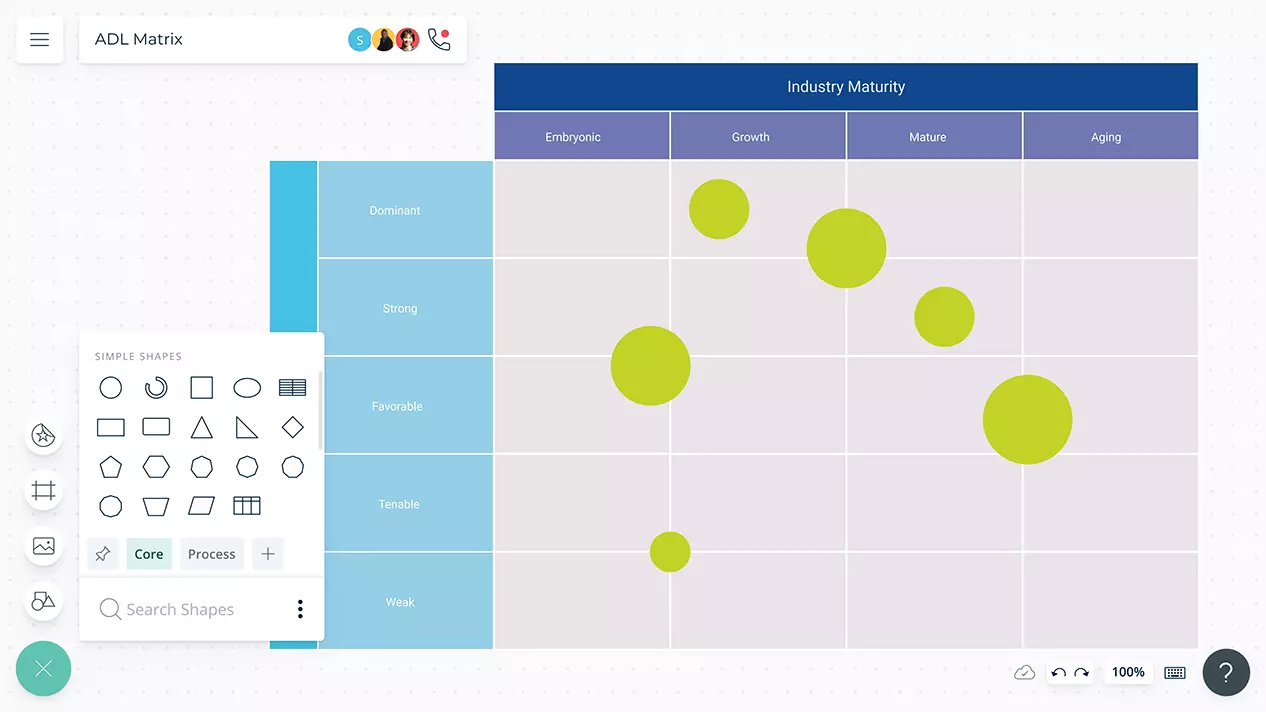
The ADL matrix also known as the strategic condition matrix is a portfolio management method. Organizations use it to gain insight into their competitive position and develop business strategies based on competitive position and industry maturity. It can also be used for strategizing marketing plans for a product or product line.
How to Create an ADL Matrix?
- Determine all the strategic business units (SBUs) of the organization.
- Identify the current stage in the lifecycle of the industry of each strategic business unit you identified earlier.
- There are 4 industry life cycle stages; Embryonic (introductory stage marked by rapid market growth and little competition), Growth (where the market continues to grow as sales increase), Mature (this is where the market is stable and has a well-established customer base and a lot of competitors) and Aging (where market demand starts to fall and companies abandon the market).
- Once you have assessed the phases of industry maturity, the next step is to identify the competitive position.
- The matrix represents 5 categories of competitive positions; Dominant (in this position you are the market leader with little competition. It’s a rare and short-lived position), Strong (here you have a strong and stable market position despite the competition), Favorable (you fall into this category if you enjoy a competitive advantage in certain segments of the market), Tenable (has a small market and stronger competitors), Weak (where the business continuously loses out on its market share).
- The next step is to plot the sizes and positions of your business units on the ADL matrix. You can use a Creately ADL matrix template, to begin with.
- Use circles to represent the SBU, and the size of the circle can be adjusted according to the size of the industry they belong to. Market share can also be highlighted on the circles by slicing them.
- Want the input of other team members or external stakeholders or consultants? Simply share the diagram share link to collaborate with them in real-time.
