Sometimes things go wrong. Well-planned projects fail, processes break down and employees lose their productivity.
To understand what happened, you need to get to the bottom of things.
Many organizations use the root cause analysis when a problem or something unplanned happens that will interrupt their business processes. It helps dig deeper and find effective solutions.
In this post, we will look at what is root cause analysis, the root cause analysis steps, and root cause analysis tools.
What is Root Cause Analysis
Root cause analysis is a method that helps understand the primary cause of a problem or why a problem occurred in the first place.
It helps you to dig into the underlying causes of the situation, thus allowing you to find appropriate solutions for it.
There are several root cause analysis tools and techniques that can be used in the investigation of a problem. But before we get to that, let’s understand how to conduct a root cause analysis first.
Root Cause Analysis Steps
A root cause analysis may take several hours of your time.
It would be easier for you if you involve a team of relevant people; for example, if you are investigating bottlenecks in a process, it would help to have the process owner and other experts for the analysis.
Follow the steps below to conduct a successful root cause analysis.
Step 1: Define the problem
Define the problem your organization is facing and gather data and evidence relevant to it and necessary to understand the current situation.
Create a problem statement which should include information about the problem like the actual impact, potential impact, the focal point, etc. However keep the statement concise.
Step 2: Determine the factors that caused the problem.
Gather a team of people directly involved in the execution of the process and corrective actions, and experts whose input can help find solutions faster.
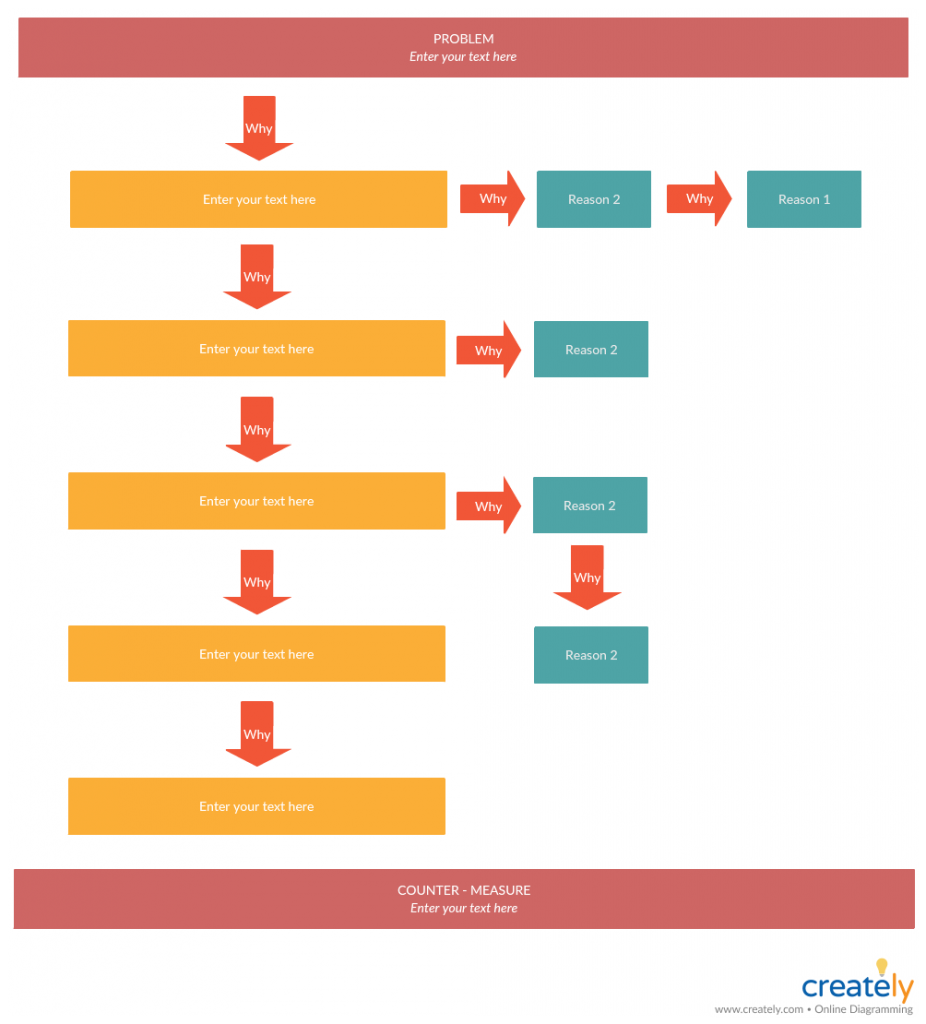
Together with the team, brainstorm the possible factors for the problem by asking ‘why?’. You can use a 5 whys diagram or a fishbone diagram here.
Step 3: Identify the root cause.
Dig deeper by continuing to ask why after the first layer of causal factors. Keep at it until finally you have discovered the fundamental cause for the problem at hand.
Step 4: Decide the corrective actions
Decide the corrective actions you need to take to eliminate the problem and prevent it from recurring. Make sure that you clearly communicate them to the people who will be involved.
Step 5: Review and evaluate
Review and evaluate the impact of the corrective actions. Make improvements as necessary.
Root Cause Analysis Tools
Many root cause analysis tools are out there. Following we have listed some that are widely used and more effective in problem-solving.
5 Whys Analysis
To carry out a 5 whys analysis, you need to gather a team of people who are affected by the problem.
As the name suggests, in the 5 whys analysis the question ‘why?’ is asked five times in the course of finding the root cause of a problem.
You can use a 5 whys template like the one below to facilitate the brainstorming session.
Once you have asked ‘why’ five times and figured out the root cause, come up with improvement measure you need to apply. Assign everyone the corrective actions that need to be taken.
Cause and Effect Analysis
Once you have identified the problem, you can use the cause and effect analysis to explore the causes of a problem and its effects.
For the analysis, you can use a cause and effect diagram, which is also known as a fishbone diagram or the Ishikawa diagram.
Just as it helps explore the factors that are preventing an outcome, it can also be used to identify the factors needed to generate the desired outcome.
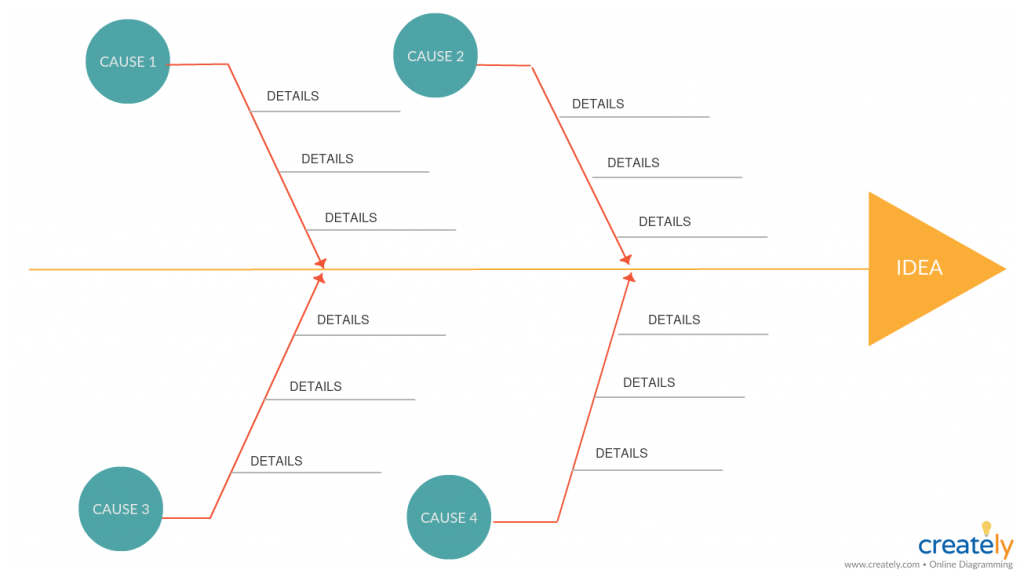
Here’s how to use the cause and effect analysis to solve business problems. You can also refer to our guide on fishbone diagrams to learn how to use the tool in more detail.
Pareto Chart
Pareto chart is a combination of a bar chart and a line graph. While the length of the bars represent the frequency or cost of faults, they are arranged in such a way that highlights the most frequent to least frequent. The chart helps prioritize your issues based on the cumulative effect they have on a system.
The Pareto chart is based on the theory that 80% of the total problems that occur are caused by 20% of problem causes. This means if you have solutions to your major problems, you can also solve a majority of your other smaller problems.
Learn how to create a Pareto chart step-by-step here.

Scatter Diagram
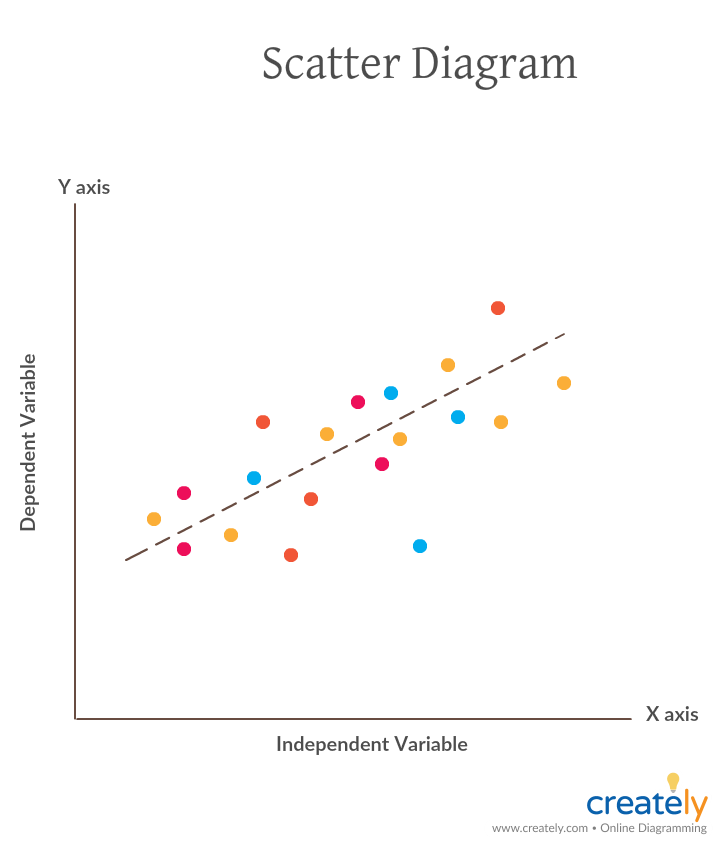
Scatter diagrams or scatter plot diagrams can be used to visualize the relationship between two variables. Once you have created a cause and effect diagram and identified potential causes to your problem, you can use the scatter diagram to determine which causes are responsible for the variation.
While the independent variable is plotted along the horizontal axis, the vertical axis is for the dependent axis. Learn more here.
Fault Tree Analysis
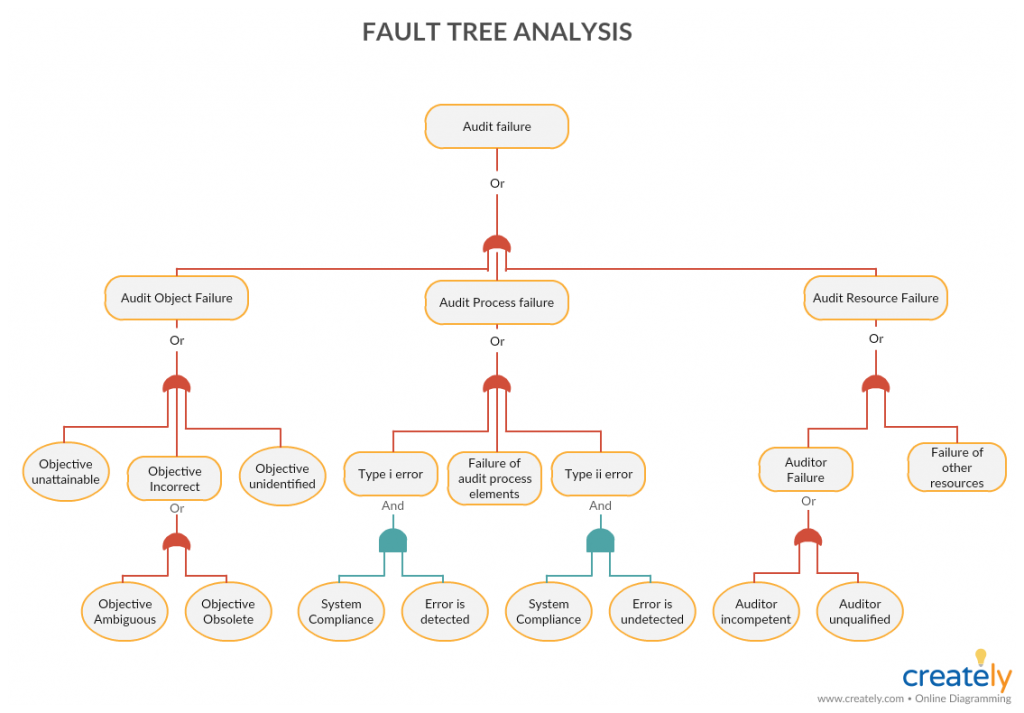
Fault tree analysis is a deductive analysis to that visually represent the failure path. You can use the fault tree analysis to determine the possible causes of a problem or an event. The fault tree starts with the event at the top and the possible causes are placed below.
Anymore Root Cause Analysis Tools?
What other root cause analysis tools do you use? Have you got any more tips on accelerating the root cause analysis steps we have discussed above? Do share them with us in the comments below.


