Supply and Demand Graph Maker
Visualize Supply & Demand Data for Better Understanding
Understand how changes in supply or demand can affect the price and quantity of a good or service in the market.
- Supply and demand graph templates to get a head start
- Migrate data to visualize on the canvas for easier analysis
- Real-time collaboration to work with stakeholders
Over 10 Million people and 1000s of teams already use Creately
Create Supply & Demand Graphs in Minutes

-
Customize supply and demand graphs with easy-to-use drag and drop tools.
-
Purpose-built shapes for grids, graphs, charts and 50+ more diagram types.
-
Link survey, market research, and sales data in one place with integrated notes.
-
Multiple pre-made supply and demand graph templates to get a quick start.


Get Your Team to Work Together

-
A shared workspace to collaborate in real-time on making collective decisions.
-
An online whiteboard with built-in brainstorming tools to analyze insights.
-
Add context to conversations with pinpointed comments and live cursor views.
Share Information and Manage Workflows

-
Import data in CSV, Excel or spreadsheets to visualize and analyze on the canvas.
-
Embed your supply and demand graphs in any site, intranet or app.
-
Export as SVGs, PNGs, JPEGs, and PDFs to add to presentations and documents.
-
In-built project management tools to manage ownership, tasks, and revisions.

What is a Supply and Demand Graph?
How Can Teams Collaborate Around Supply and Demand Graphs?
-
Analyzing price and quantity: Teams can use supply and demand graphs to analyze the relationship between price and quantity. The graph shows how changes in price and quantity affect supply and demand and can help teams identify the optimal price and quantity to maximize profits.
-
Anticipating changes in demand and supply: Teams can use supply and demand graphs to anticipate changes in demand and supply, such as changes in consumer preferences, technology, or regulations. By identifying these changes, teams can adjust their strategies accordingly and take advantage of new opportunities or mitigate potential risks.
-
Evaluating market competition: Teams can use supply and demand graphs to evaluate market competition and identify opportunities to differentiate their products from competitors. For example, they can use the graph to analyze the impact of price changes by competitors on their own demand and adjust their strategies accordingly.
-
Predicting future trends: Teams can use supply and demand graphs to predict future trends in the market and adjust their strategies accordingly. For example, they can use the graph to identify potential changes in demand or supply and develop new products or services to meet those needs.
How to Create a Supply and Demand Graph with Your Team in Creately?
-
Open a Creately workspace and share it with the team to gather data on the supply and demand of the chosen goods or services. You can use real-time mouse cursors and synced previews to easily track the changes other participants make in the workspace.
-
Gather the information you need. Identify the key details on pricing changes, demand and supply quantities over a certain time period.
-
Create a rough outline of the graph by arranging the gathered information in a chronological order. This step will also help you filter out the key details from the rest of the researched data.
-
Creately offers an array of templates for you to pick a layout for your graph and get started quickly. Once you have selected the Creately template, add pricing data to the horizontal line and the quantity details to the vertical line.
-
Mark the demand and supply data for each price to get the demand and supply curves. You will identify the equilibrium pricing at this point. You can draw many of these for each time period on the same sheet to analyze and compare.
-
Style your graph and add images if necessary. With Creately, you can quickly style your graph with attractive and professional color themes. While you can import images, clip art, gifs, logos, icons, etc. right from your device to customize your graph, you can also use the built-in Google image search to find more images.
-
Share your graph with other key stakeholders or team members to gather their feedback with contextual comments on Creately. You can download your supply and demand graphs as SVGs, PNGs, JPEGs, or PDFs for printing, sharing, publishing, or presentations. You can also share it with anyone via email.
Quickly Create Supply and Demand Graphs with Premade Templates
FAQs about the Supply and Demand Graph Maker
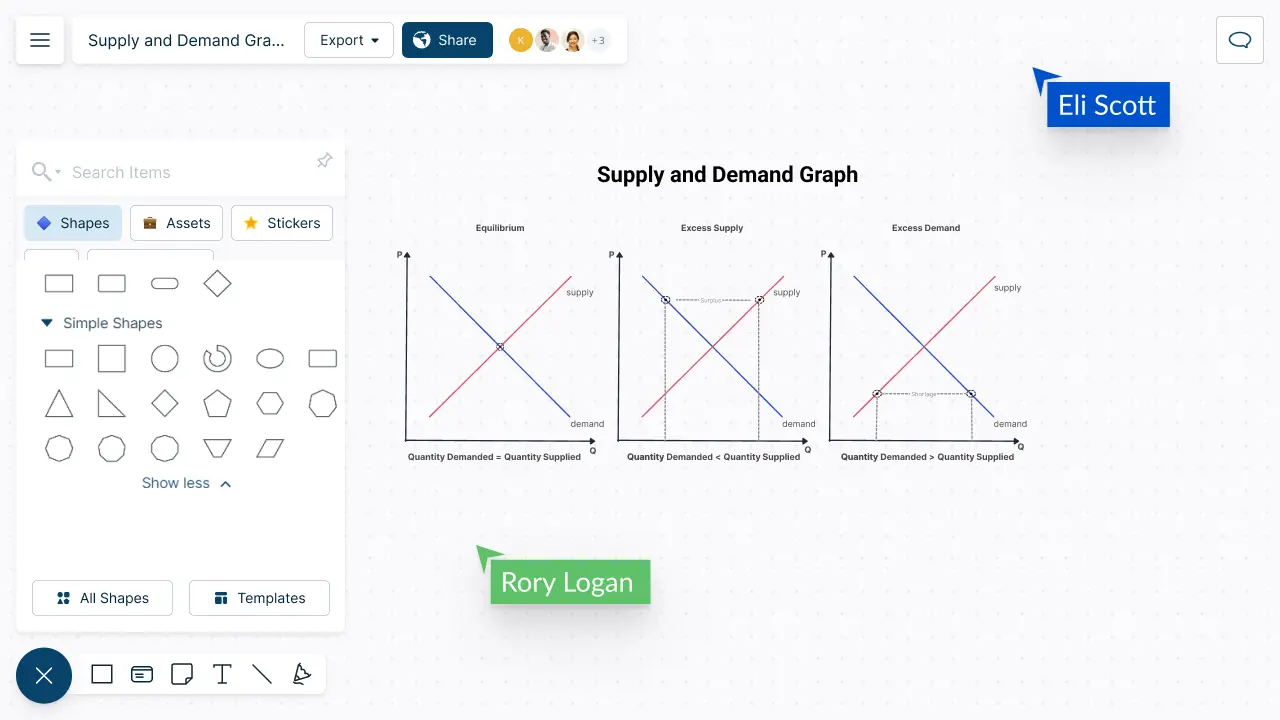
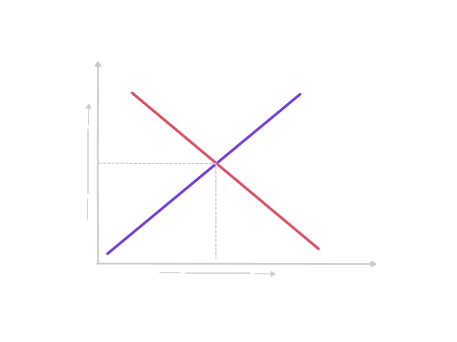
One of the building blocks or fundamental principles of economics, the supply and demand graph, helps to determine the price of a good or service in the market. The graph can help businesses to understand what customers need and provide what is required at a reasonable price.
The law of supply and demand can also help economists and investors understand and predict market conditions.
-
As the price increases, supply rises while demand decreases.
-
As price decreases, supply decreases while demand increases.
-
The intersection of the two curves, the equilibrium price or the market clearing price, balances the supply and demand.
Yes, you can. To get a link to embed in a particular site, go to the share option at the top left-hand corner of the workspace. Select ‘embed’ to get the required link.
You can download the workspace as an SVG, PNG, JPEG, or PDF to share. If you want to collaborate and give access to your co-workers to edit, go to collaborators in the share panel and send an invite by including their email. Don’t forget to select the ‘can edit’ option when sending the invite.
Streamline Your Workflows by Integrating with the Tools You Love
Creately integrates with the tools your teams use every day and supports your team’s workflow seamlessly.


Why is Creately a Better Supply and Demand Graph Maker
Creately is the intelligent visual platform enabling visual collaboration, knowledge management and project execution.
100+ proprietary features deliver a flexible, no-code visual platform, expertly-tuned for ease of use.
Infinite Visual Canvas
Visually create and organize any structure you imagine. Drag drop shapes or datasets, embed external content.
Real-time Collaboration
Work remote or hybrid with realtime cursor tracking, synced previews and proper in-context comments and tasks.
Custom Databases
Create custom databases for any kind of information from tasks, HR personnel records to matters for law firms.
Data Driven Docs
Create docs and notes to go deeper from the high-level visual views. 2 way link to other docs, shapes or data with @mentions
Professional Diagramming
50+ types of standard diagrams with 1000+ specially designed shapes and connectors enable blazing fast diagramming.
Project & Task Management
Use built-in agile project management tooling or integrate with your favourite project management tool to keep work flowing.
Enterprise Grade Security
ISO 27001, SOC 2 - Type 2, Data Residency & Up-time SLAs to collaborate securely with your entire organization.
Powerful Visual Modelling
Visuals that are backed by databases, update once, reflect in multiple views type of workflows.







Enterprise-Grade Security and Compliance

We’re dedicated to keeping your data private, secure and safe. Creately is SOC2-Type 2 and ISO 27001 certified and GDPR compliant. We offer flexible data residency options in USA, EU and Australia to our enterprise customers.
Just Plug and Play

An easy-to-use interface with a minimal learning curve. Simply Sign-In using your work email to automatically add team members to the enterprise plan.
No installation required.

Work Visually with Anyone for a Fixed Monthly Price
- Unlimited Canvases
- Unlimited items per Canvas
- 20 Active Folders
- 5GB storage
- 30 day version history
- Unlimited Imports
- All export formats
- Basic collaboration
- Email Support
- Unlimited workspaces
- 1000 Items per canvas
- 10 active folders
- Basic collaboration
- 100 Imports
- High Res Exports
- 5000 items per canvas
- 50 active folders
- 30 day version history
- Advanced collaboration
- 100 Imports
- Multiple named users
- Unlimited Databases
- 5000 items per Database
- Project Management tools
- HR, Product, IT, Process toolkits
- Advanced collaboration
- Most integrations
- 100 GB storage
- One Account Admin
- Email + Chat support
- SOC2 & ISO27001 Security
- Unlimited items per canvas
- Unlimited folders
- 1 year version history
- Unlimited databases
- 5000 items per DB
- One account admin
- Email + Chat support
- SOC 2 & ISO 27001 Security
- 3 Canvases (60 items max)
- 1 Folder
- Limited storage
- Basic integrations
- Raster image only exports
- Unlimited items per DB
- Unlimited 2-way data sync from integrations
- All integrations
- Sharing controls
- Multiple Account Admins
- Multiple Sub-Teams
- Single Sign On
- Customer success + account management
- SOC2 & ISO27001 Security
- Custom Data Residency
- Unlimited items per DB
- Unlimited 2 way data sync
- All integrations
- Sharing controls
- Multiple Account Admins
- Multiple Sub Teams
- Customer Success Manager
- SOC 2 & ISO 27001 Security
- Custom Data Residency


